

Every year in Australia as we approach the summer months, the Rural Fire Service undertakes a scheduled hazard reduction process known as back-burning. The principle is straightforward; by clearing bushland of accumulated fuel (kindling) through controlled burning, the Rural Fire Service can help prevent larger, uncontrollable infernos.
Hazard reduction is an important and often overlooked part of investing. Markets have a tendency to move between states of fearing the future where people believe there is no justification for being in markets (usually coincides with market bottoms), to believing that risk is easily measured and controlled. At that point the fear of missing out is all encompassing (and correlations with a market top are typically quite high).
There are several measures that we look at to give an indication of attitudes towards risk. One example is the Chicago Board Options Exchange volatility or VIX index, which is a measure of implied volatilities based on a number of S&P 500 index options.
Some market participants believe the VIX index reflects the risk in the market at a point in time. Our view, however, is that it reflects what people believe is the current risk in the market and it becomes self-fulfilling. As markets climb, the VIX index usually falls, as investors believe that risk is falling.
In our opinion, investors should be thinking quite the opposite.
Risk in low volatility stocks are at 20 year highs
We can observe the behaviour of investors by looking at the current valuations that the market is willing to pay to gain access to a company’s future dividends and cash flows. Below is a chart supplied by Goldman Sachs, which shows the beta (a measure of volatility or systemic risk of a company) for ‘low volatility’ companies.
The systematic risk of 'Low Vol' stocks sits at a 20-year high
Average Beta (4-yr vs ASX 200) of 'low volatility' stocks.
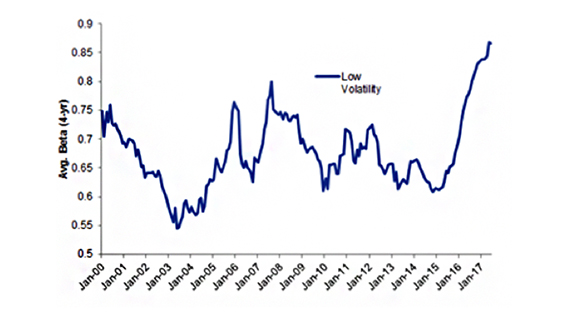
Source: Goldman Sachs Global Investment Research, FactSet, IRESS, I/B/E/S
Historically, ‘low volatility‘ stocks have had lower levels of market risk. The chart indicates that the market has pushed up the prices of what are considered ‘low volatility’ stocks. If you purchase these companies today, you are taking on close to market risk or materially higher risk than has historically been the case. A sample of the stocks included in this ‘low volatility’ basket are listed below –
|
|
These companies tend to have low volatility in earnings and cashflow. Due to low interest rates the market has pushed the valuations of these companies up to a point whereby any change to expectations of interest rate changes may lead to a material change in the value of these companies.
Change is in the air
Analysis of the balance sheets of these companies shows that quite a few of them have significant levels of financial leverage. This is in part due to a market environment over the past 10 years where interest rates have been extremely low and real rates have been negative.
As long as interest rates do not rise, these valuations may be justifiable.
However, many central bankers, from the Federal Reserve to the European Central Bank to the Bank of England, have been ‘jawboning’ about unwinding the asset purchases that have occurred over the last ten years, which will place upward pressure on the long end of the interest rate yield curve.
Even the Reserve Bank of Australia has been talking about a neutral interest rate setting for Australia. That's likely to be around 3.5% - which is materially above current levels.
Two key takeaways
The adage goes that where there’s smoke there’s usually a fire and Perpetual’s conservative approach to investing has a proven record of acting as an early warning system for investors.
- Firstly, and most importantly, be aware of what price/valuation you are paying to get access to a company’s future cash flows/dividend stream.
- Secondly, the valuation that other investors are willing to pay can tell you critical information about the risk appetite of the market. The above example shows that the valuations of ‘low risk/low volatility’ companies have been pushed up to levels whereby investors may be taking on a lot more risk than they think.
This information has been prepared by Perpetual Investment Management Limited (PIML) ABN 18 000 866 535, AFSL 234426 and issued by Perpetual Trustee Company Limited (PTCo) ABN 42 000 001 007, AFSL 236643. It is general information only and is not intended to provide you with financial advice or take into account your objectives, financial situation or needs. You should consider, with a financial adviser, whether the information is suitable for your circumstances. To the extent permitted by law, no liability is accepted for any loss or damage as a result of any reliance on this information. The information is believed to be accurate at the time of compilation and is provided in good faith. This document may contain information contributed by third parties. PIML does not warrant the accuracy or completeness of any information contributed by a third party. Any views expressed in this document are opinions of the author at the time of writing and do not constitute a recommendation to act. No company in the Perpetual Group (Perpetual Group means Perpetual Limited ABN 86 000 431 827 and its subsidiaries) guarantees the performance of any fund or the return of an investor’s capital. Past performance is not indicative of future performance.